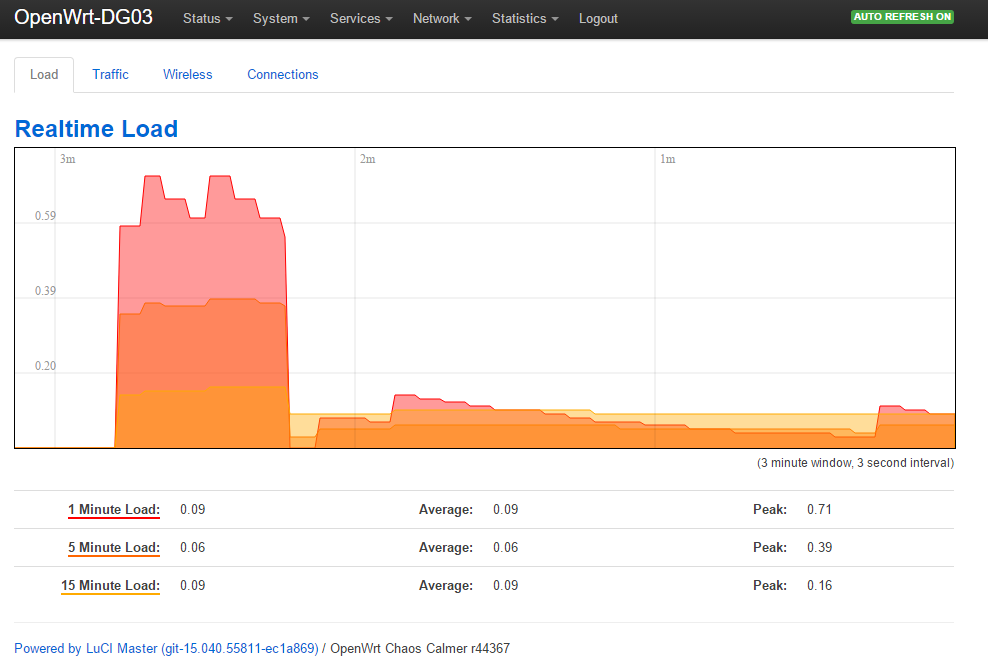
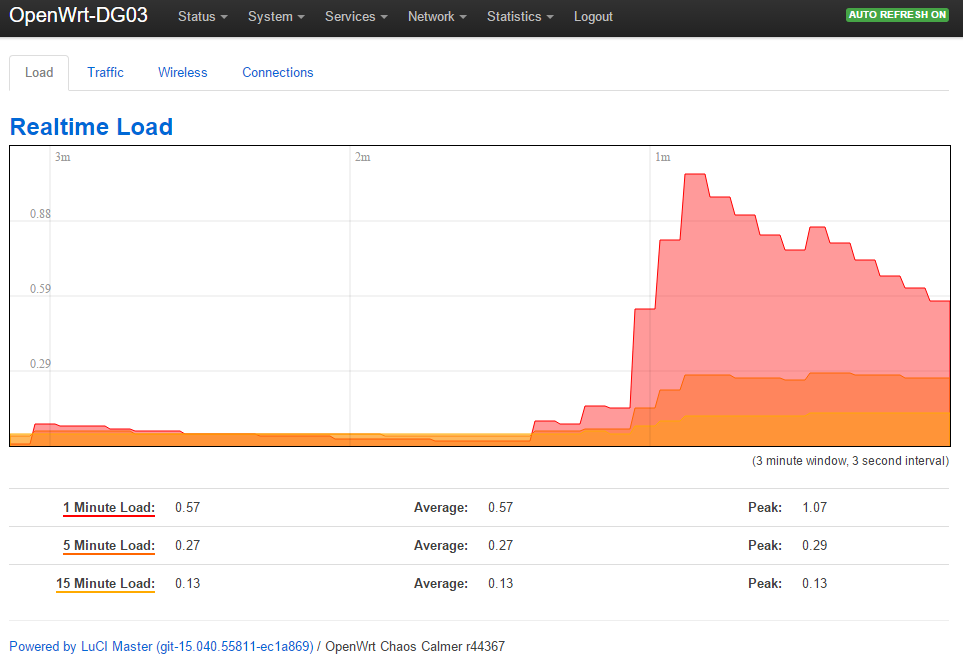
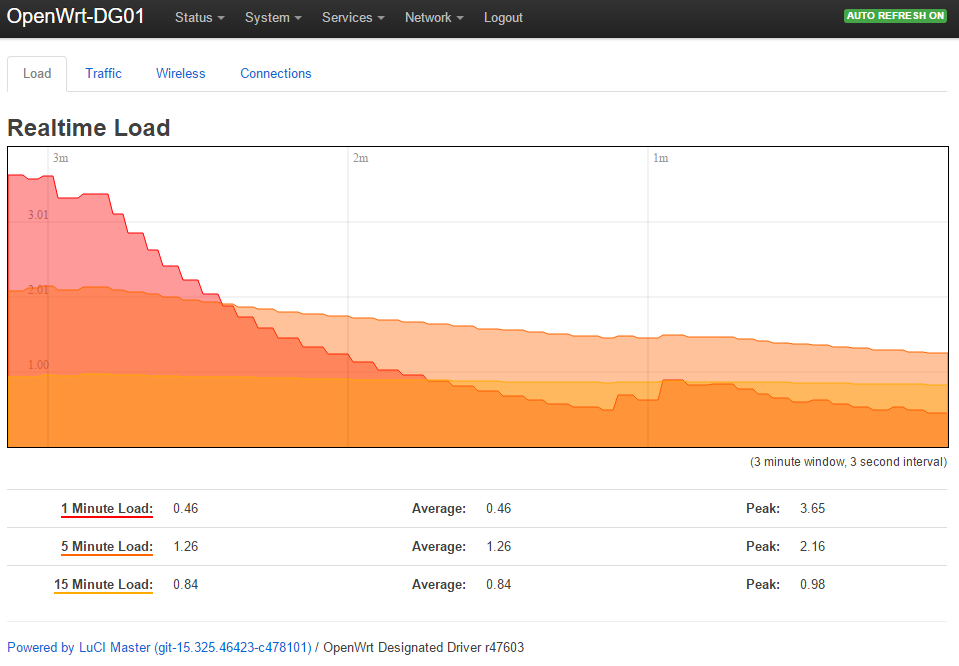
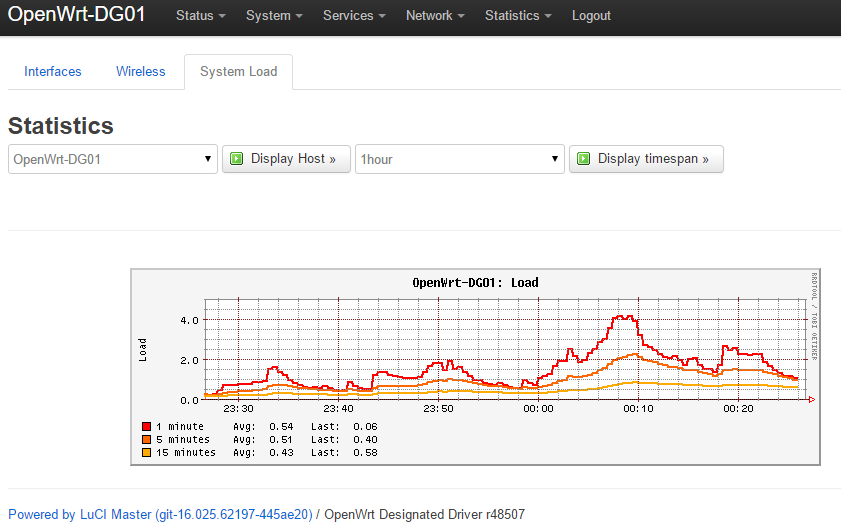
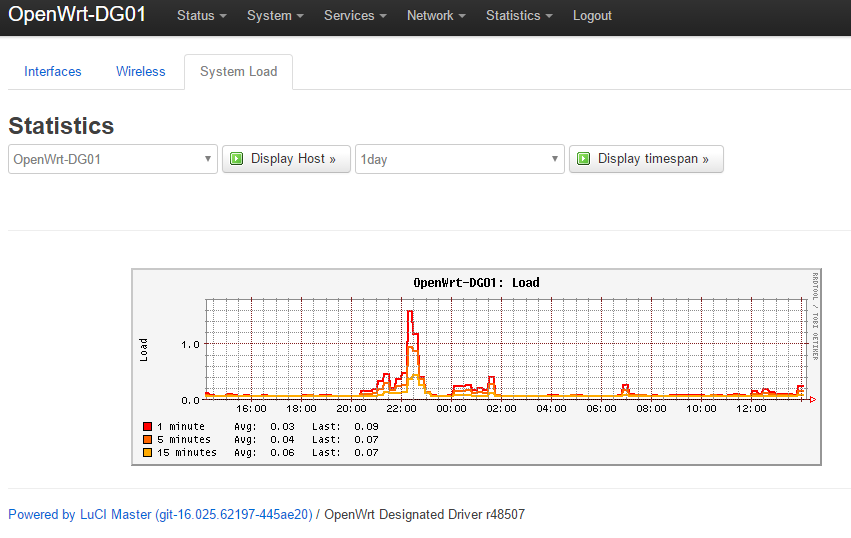
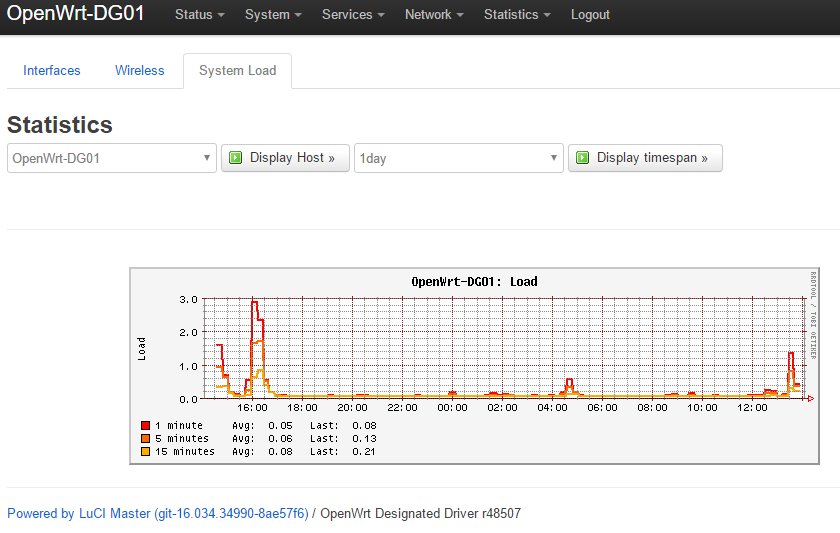
For testing (again) switched over to the OpenWrt Designated Driver r47603 on F1, but still after 2 hours usage it looks like the box is soo busy with 'something':
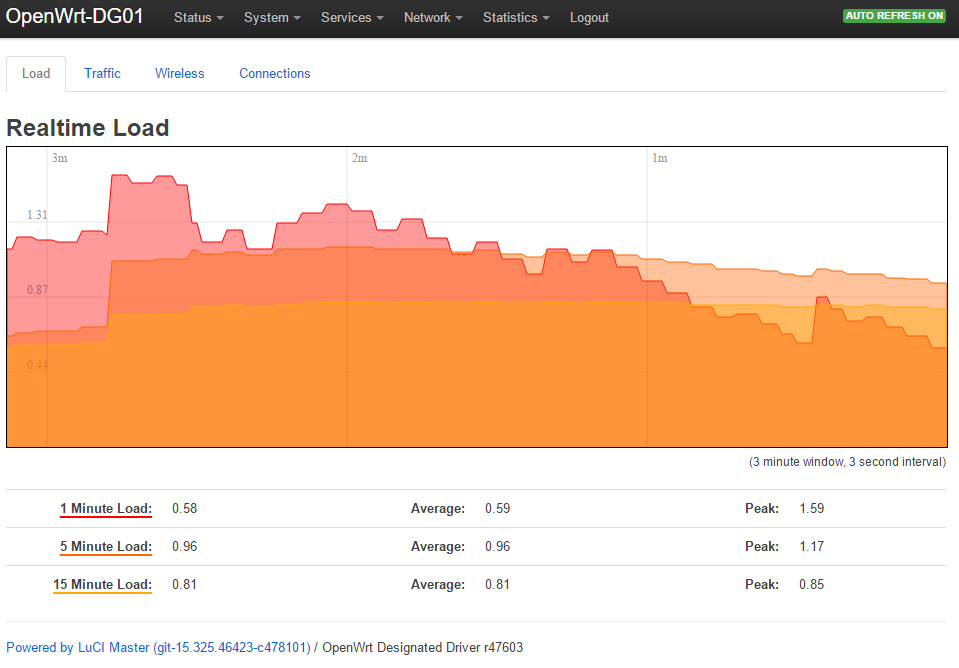
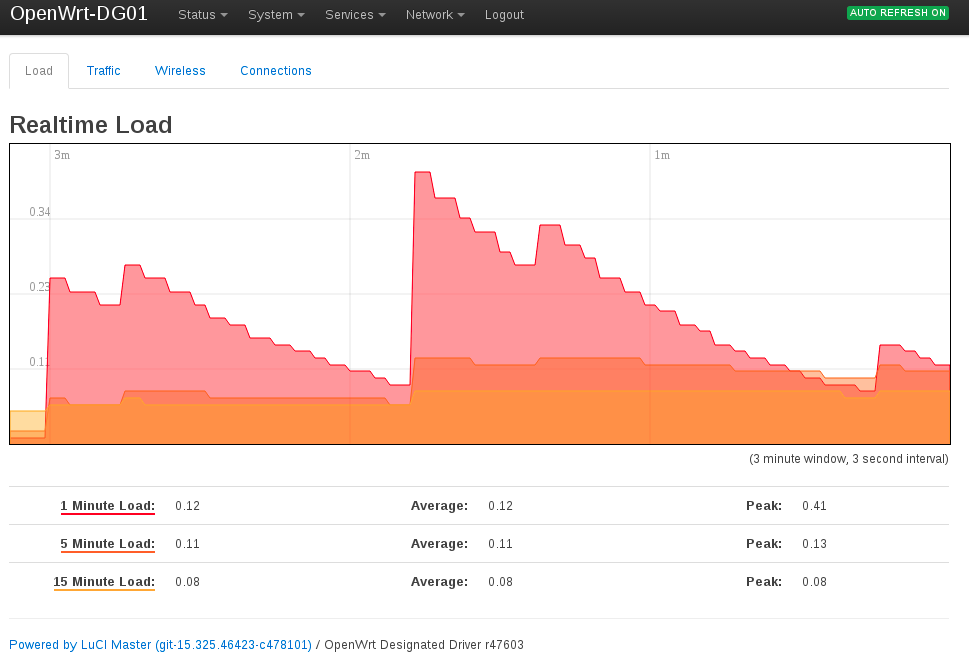
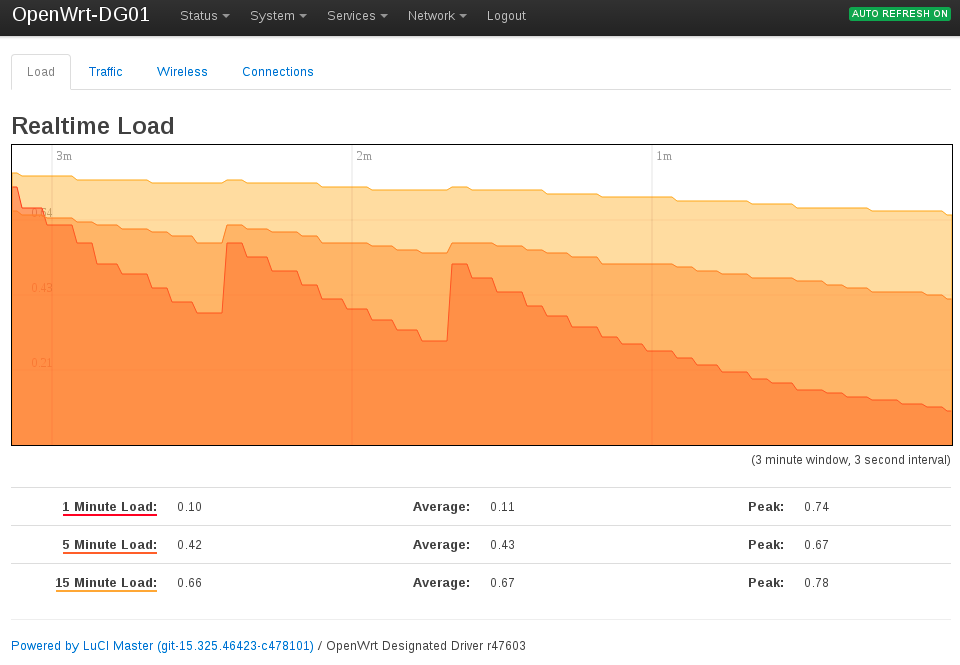
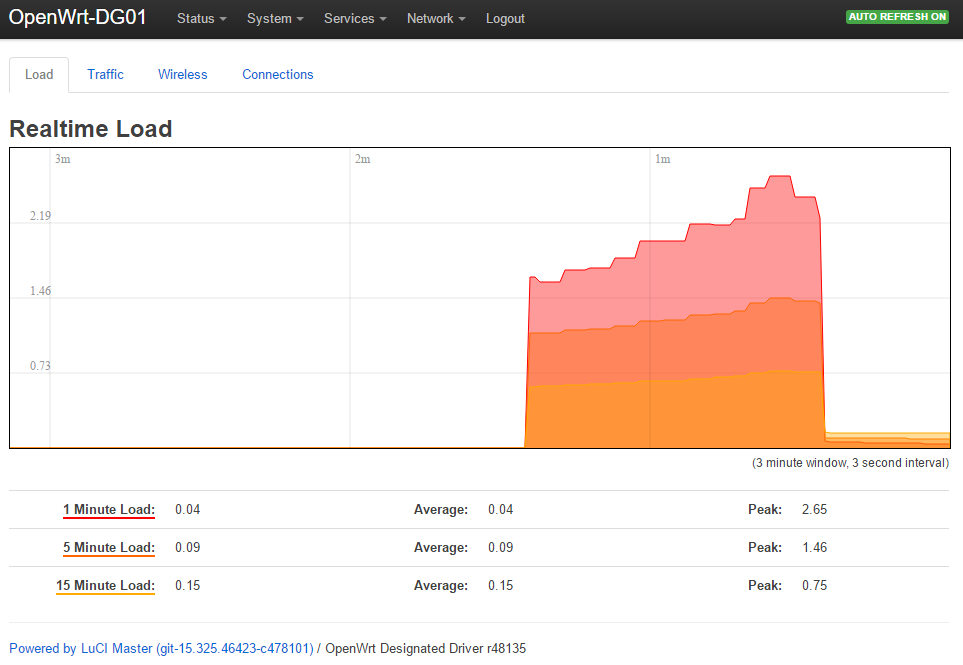
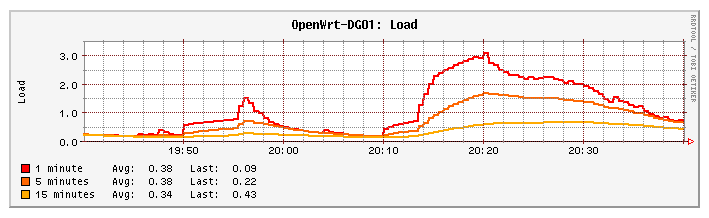
Also Collectd has a strange 'figure':
Strange however that i can't find anything with 'top' that uses a lot of CPU %, on my putty session to the same box:
Code: Select all
Mem: 22956K used, 101852K free, 1516K shrd, 0K buff, 10024K cached
CPU:   8% usr   2% sys   0% nic  88% idle   0% io   0% irq   0% sirq
Load average: 0.02 0.40 0.62 1/63 22349
  PID  PPID USER     STAT   VSZ %VSZ %CPU COMMAND
31349 30990 root     R     1184   1%   0% top
  779     1 root     S     1696   1%   0% /sbin/netifd
    1     0 root     S     1540   1%   0% /sbin/procd
  348     1 root     S     1232   1%   0% /sbin/ubusd
30946 30463 root     S     1112   1%   0% /usr/sbin/dropbear -F -P /var/run/dro
  133     2 root     SW       0   0%   0% [kworker/0:1]
14080     2 root     SW       0   0%   0% [kworker/u2:2]
 1615     1 privoxy  S     3580   3%   0% /usr/sbin/privoxy --pidfile /var/run/
30652     1 root     S     3424   3%   0% /usr/sbin/collectd
  857     1 root     S     2088   2%   0% /usr/sbin/uhttpd -f -h /www -r OpenWr
 1212     1 root     S     1568   1%   0% /usr/sbin/wpa_supplicant -B -P /var/r
  740     1 root     S     1444   1%   0% /sbin/rpcd
  801     1 root     S     1284   1%   0% /usr/sbin/odhcpd
  944     1 root     S     1188   1%   0% /usr/sbin/ntpd -n -S /usr/sbin/ntpd-h
30990 30946 root     S     1184   1%   0% -ash
 1286   779 root     S     1184   1%   0% udhcpc -p /var/run/udhcpc-wlan0.pid -
  731     1 root     S     1180   1%   0% /sbin/logd -S 16
30463     1 root     S     1048   1%   0% /usr/sbin/dropbear -F -P /var/run/dro
  349     1 root     S      896   1%   0% /sbin/askfirst /bin/ash --login
    3     2 root     SW       0   0%   0% [ksoftirqd/0]
I probably have to make new openWrt image, with a less as possible libraries, as some are now 'automatically' added (like atm-esi) which i don't need -or use- and can be removed without any change (on my configurations) ...
Full log of 4.1.11, which does not show anything strange):
Code: Select all
[    0.000000] Linux version 4.1.11 (dguser@DGDEB02) (gcc version 4.8.3 (OpenWrt/Linaro GCC 4.8-2014.04 r47603) ) #1 Mon Nov 23 21:33:53 CET 2015
[    0.000000] SoC: VR9 rev 1.1
[    0.000000] bootconsole [early0] enabled
[    0.000000] CPU0 revision is: 00019555 (MIPS 34Kc)
[    0.000000] MIPS: machine is P2812HNUF1 - ZyXEL P-2812HNU-F1
[    0.000000] Determined physical RAM map:
[    0.000000]  memory: 08000000 @ 00000000 (usable)
[    0.000000] Initrd not found or empty - disabling initrd
[    0.000000] Zone ranges:
[    0.000000]   Normal   [mem 0x0000000000000000-0x0000000007ffffff]
[    0.000000] Movable zone start for each node
[    0.000000] Early memory node ranges
[    0.000000]   node   0: [mem 0x0000000000000000-0x0000000007ffffff]
[    0.000000] Initmem setup node 0 [mem 0x0000000000000000-0x0000000007ffffff]
[    0.000000] On node 0 totalpages: 32768
[    0.000000] free_area_init_node: node 0, pgdat 80499e00, node_mem_map 810096c0
[    0.000000]   Normal zone: 256 pages used for memmap
[    0.000000]   Normal zone: 0 pages reserved
[    0.000000]   Normal zone: 32768 pages, LIFO batch:7
[    0.000000] Primary instruction cache 32kB, VIPT, 4-way, linesize 32 bytes.
[    0.000000] Primary data cache 32kB, 4-way, VIPT, cache aliases, linesize 32 bytes
[    0.000000] pcpu-alloc: s0 r0 d32768 u32768 alloc=1*32768
[    0.000000] pcpu-alloc: [0] 0
[    0.000000] Built 1 zonelists in Zone order, mobility grouping on.  Total pages: 32512
[    0.000000] Kernel command line: console=ttyLTQ0,115200 init=/etc/preinit
[    0.000000] PID hash table entries: 512 (order: -1, 2048 bytes)
[    0.000000] Dentry cache hash table entries: 16384 (order: 4, 65536 bytes)
[    0.000000] Inode-cache hash table entries: 8192 (order: 3, 32768 bytes)
[    0.000000] Writing ErrCtl register=00064482
[    0.000000] Readback ErrCtl register=00064482
[    0.000000] Memory: 124652K/131072K available (3680K kernel code, 148K rwdata, 988K rodata, 156K init, 207K bss, 6420K reserved, 0K cma-reserved)
[    0.000000] NR_IRQS:256
[    0.000000] CPU Clock: 500MHz
[    0.000000] clocksource MIPS: mask: 0xffffffff max_cycles: 0xffffffff, max_idle_ns: 7645041786 ns
[    0.000010] sched_clock: 32 bits at 250MHz, resolution 4ns, wraps every 8589934590ns
[    0.008189] Calibrating delay loop... 332.54 BogoMIPS (lpj=665088)
[    0.042306] pid_max: default: 32768 minimum: 301
[    0.047292] Mount-cache hash table entries: 1024 (order: 0, 4096 bytes)
[    0.053765] Mountpoint-cache hash table entries: 1024 (order: 0, 4096 bytes)
[    0.067743] clocksource jiffies: mask: 0xffffffff max_cycles: 0xffffffff, max_idle_ns: 7645041785100000 ns
[    0.077455] pinctrl core: initialized pinctrl subsystem
[    0.083240] NET: Registered protocol family 16
[    0.092460] pinctrl-xway 1e100b10.pinmux: Init done
[    0.097974] dma-xway 1e104100.dma: Init done - hw rev: 7, ports: 7, channels: 28
[    0.208134] dcdc-xrx200 1f106a00.dcdc: Core Voltage : 1016 mV
[    0.215403] PCI host bridge /fpi@10000000/pci@E105400 ranges:
[    0.221047]  MEM 0x0000000018000000..0x0000000019ffffff
[    0.226299]   IO 0x000000001ae00000..0x000000001affffff
[    0.253336] gpio-stp-xway 1e100bb0.stp: Init done
[    0.258753] usbcore: registered new interface driver usbfs
[    0.264241] usbcore: registered new interface driver hub
[    0.269608] usbcore: registered new device driver usb
[    0.274965] PCI host bridge to bus 0000:00
[    0.278944] pci_bus 0000:00: root bus resource [mem 0x18000000-0x19ffffff]
[    0.285872] pci_bus 0000:00: root bus resource [io  0xffffffff]
[    0.291852] pci_bus 0000:00: root bus resource [??? 0x00000000 flags 0x0]
[    0.298703] pci_bus 0000:00: No busn resource found for root bus, will use [bus 00-ff]
[    0.306748] pci 0000:00:0e.0: [1814:3062] type 00 class 0x028000
[    0.306794] pci 0000:00:0e.0: reg 0x10: [mem 0xffff0000-0xffffffff]
[    0.307168] pci_bus 0000:00: busn_res: [bus 00-ff] end is updated to 00
[    0.307210] pci 0000:00:0e.0: BAR 0: assigned [mem 0x18000000-0x1800ffff]
[    0.314902] Switched to clocksource MIPS
[    0.320429] NET: Registered protocol family 2
[    0.325761] TCP established hash table entries: 1024 (order: 0, 4096 bytes)
[    0.332642] TCP bind hash table entries: 1024 (order: 0, 4096 bytes)
[    0.339021] TCP: Hash tables configured (established 1024 bind 1024)
[    0.345566] UDP hash table entries: 256 (order: 0, 4096 bytes)
[    0.351375] UDP-Lite hash table entries: 256 (order: 0, 4096 bytes)
[    0.358041] NET: Registered protocol family 1
[    0.362388] PCI: CLS 0 bytes, default 32
[    0.362727] gptu: totally 6 16-bit timers/counters
[    0.367536] gptu: misc_register on minor 63
[    0.371645] gptu: succeeded to request irq 126
[    0.376135] gptu: succeeded to request irq 127
[    0.380648] gptu: succeeded to request irq 128
[    0.385162] gptu: succeeded to request irq 129
[    0.389676] gptu: succeeded to request irq 130
[    0.394189] gptu: succeeded to request irq 131
[    0.399470] ralink,eeprom ralink_eep: using RT3062.eeprom as eeprom
[    0.405847] phy-xrx200 gphy-xrx200: requesting lantiq/vr9_phy11g_a1x.bin
[    0.413148] phy-xrx200 gphy-xrx200: booting GPHY0 firmware at 7980000
[    0.419466] phy-xrx200 gphy-xrx200: booting GPHY1 firmware at 7980000
[    0.527236] futex hash table entries: 256 (order: -1, 3072 bytes)
[    0.541989] squashfs: version 4.0 (2009/01/31) Phillip Lougher
[    0.547728] jffs2: version 2.2 (NAND) (SUMMARY) (LZMA) (RTIME) (CMODE_PRIORITY) (c) 2001-2006 Red Hat, Inc.
[    0.559349] io scheduler noop registered
[    0.563180] io scheduler deadline registered (default)
[    0.569028] 1e100c00.serial: ttyLTQ0 at MMIO 0x1e100c00 (irq = 112, base_baud = 0) is a lantiq,asc
[    0.577916] console [ttyLTQ0] enabled
[    0.585250] bootconsole [early0] disabled
[    0.596533] nand: device found, Manufacturer ID: 0xec, Chip ID: 0xf1
[    0.601424] nand: Samsung NAND 128MiB 3,3V 8-bit
[    0.606038] nand: 128 MiB, SLC, erase size: 128 KiB, page size: 2048, OOB size: 64
[    0.613684] Scanning device for bad blocks
[    0.697228] Bad eraseblock 973 at 0x0000079a0000
[    0.704522] 4 ofpart partitions found on MTD device 10000000.nand-parts
[    0.709705] Creating 4 MTD partitions on "10000000.nand-parts":
[    0.715626] 0x000000000000-0x000000040000 : "uboot"
[    0.721625] 0x000000040000-0x000000060000 : "uboot-env"
[    0.726792] 0x000000060000-0x000000260000 : "kernel"
[    0.731830] 0x000000260000-0x000008000000 : "ubi"
[    0.839486] libphy: lantiq,xrx200-mdio: probed
[    0.852895] net-xrx200: invalid MAC, using random
[    0.919632] eth0: attached PHY [Lantiq XWAY VR9 GPHY 11G v1.3] (phy_addr=0:00, irq=-1)
[    0.987606] eth0: attached PHY [Lantiq XWAY VR9 GPHY 11G v1.3] (phy_addr=0:01, irq=-1)
[    1.055592] eth0: attached PHY [Lantiq XWAY VR9 GPHY 11G v1.4] (phy_addr=0:11, irq=-1)
[    1.123591] eth0: attached PHY [Lantiq XWAY VR9 GPHY 11G v1.4] (phy_addr=0:13, irq=-1)
[    1.191608] eth0: attached PHY [Lantiq XWAY VR9 GPHY 11G v1.3] (phy_addr=0:05, irq=-1)
[    1.199490] wdt 1f8803f0.watchdog: Init done
[    1.205759] NET: Registered protocol family 10
[    1.213788] NET: Registered protocol family 17
[    1.216935] bridge: automatic filtering via arp/ip/ip6tables has been deprecated. Update your scripts to load br_netfilter if you need this.
[    1.229459] 8021q: 802.1Q VLAN Support v1.8
[    1.237427] UBI: auto-attach mtd3
[    1.239170] ubi0: attaching mtd3
[    1.423599] ubi0: scanning is finished
[    1.437738] ubi0: attached mtd3 (name "ubi", size 125 MiB)
[    1.441818] ubi0: PEB size: 131072 bytes (128 KiB), LEB size: 129024 bytes
[    1.448660] ubi0: min./max. I/O unit sizes: 2048/2048, sub-page size 512
[    1.455360] ubi0: VID header offset: 512 (aligned 512), data offset: 2048
[    1.462148] ubi0: good PEBs: 1004, bad PEBs: 1, corrupted PEBs: 0
[    1.468242] ubi0: user volume: 1, internal volumes: 1, max. volumes count: 128
[    1.475471] ubi0: max/mean erase counter: 8/4, WL threshold: 4096, image sequence number: 2124863025
[    1.484607] ubi0: available PEBs: 0, total reserved PEBs: 1004, PEBs reserved for bad PEB handling: 19
[    1.494576] ubi0: background thread "ubi_bgt0d" started, PID 245
[    1.522223] UBIFS (ubi0:0): background thread "ubifs_bgt0_0" started, PID 247
[    1.550270] UBIFS (ubi0:0): recovery needed
[    1.941969] UBIFS (ubi0:0): recovery completed
[    1.945104] UBIFS (ubi0:0): UBIFS: mounted UBI device 0, volume 0, name "rootfs"
[    1.952391] UBIFS (ubi0:0): LEB size: 129024 bytes (126 KiB), min./max. I/O unit sizes: 2048 bytes/2048 bytes
[    1.962299] UBIFS (ubi0:0): FS size: 125153280 bytes (119 MiB, 970 LEBs), journal size 9033728 bytes (8 MiB, 71 LEBs)
[    1.972910] UBIFS (ubi0:0): reserved for root: 0 bytes (0 KiB)
[    1.978750] UBIFS (ubi0:0): media format: w4/r0 (latest is w4/r0), UUID 12440810-E598-4ABB-BF86-69AE2B68E2F0, small LPT model
[    1.990678] VFS: Mounted root (ubifs filesystem) on device 0:11.
[    1.996594] Freeing unused kernel memory: 156K (804b9000 - 804e0000)
[    2.138739] init: Console is alive
[    2.141005] init: - watchdog -
[    2.332875] dwc2 1e101000.ifxhcd: requested GPIO 489
[    3.191209] dwc2 1e101000.ifxhcd: DWC OTG Controller
[    3.194775] dwc2 1e101000.ifxhcd: new USB bus registered, assigned bus number 1
[    3.202110] dwc2 1e101000.ifxhcd: irq 62, io mem 0x00000000
[    3.207632] dwc2 1e101000.ifxhcd: Hardware does not support descriptor DMA mode -
[    3.215082] dwc2 1e101000.ifxhcd: falling back to buffer DMA mode.
[    3.222473] hub 1-0:1.0: USB hub found
[    3.225489] hub 1-0:1.0: 1 port detected
[    4.087098] dwc2 1e106000.ifxhcd: DWC OTG Controller
[    4.090667] dwc2 1e106000.ifxhcd: new USB bus registered, assigned bus number 2
[    4.098003] dwc2 1e106000.ifxhcd: irq 91, io mem 0x00000000
[    4.103527] dwc2 1e106000.ifxhcd: Hardware does not support descriptor DMA mode -
[    4.110976] dwc2 1e106000.ifxhcd: falling back to buffer DMA mode.
[    4.118326] hub 2-0:1.0: USB hub found
[    4.121412] hub 2-0:1.0: 1 port detected
[    4.148549] init: - preinit -
[    4.313199] random: procd urandom read with 15 bits of entropy available
[    4.502930] usb 2-1: new high-speed USB device number 2 using dwc2
[    4.919055] eth0: port 0 got link
[    7.449171] mount_root: mounting /dev/root
[    7.476177] procd: - early -
[    7.477734] procd: - watchdog -
[    8.070046] procd: - ubus -
[    9.089059] procd: - init -
[   10.176130] IFXOS, Version 1.5.19 (c) Copyright 2009, Lantiq Deutschland GmbH
[   10.197173] NET: Registered protocol family 8
[   10.200129] NET: Registered protocol family 20
[   10.217118] PPP generic driver version 2.4.2
[   10.230986] ip6_tables: (C) 2000-2006 Netfilter Core Team
[   10.287857] Lantiq (VRX) DSL CPE MEI driver, version 1.4.8.4, (c) 2013 Lantiq Deutschland GmbH
[   10.287857]
[   10.287857] Lantiq CPE API Driver version: DSL CPE API V4.16.2.4
[   10.342163]
[   10.342163] Predefined debug level: 3
[   10.355097] Loading modules backported from Linux version master-2015-10-26-0-g28c26cb
[   10.361612] Backport generated by backports.git backports-20150903-4-g12cf266
[   10.374605] ip_tables: (C) 2000-2006 Netfilter Core Team
[   10.388930] Infineon Technologies DEU driver version 2.0.0
[   10.394586] IFX DEU DES initialized (multiblock).
[   10.398784] IFX DEU AES initialized (multiblock).
[   10.402999] IFX DEU ARC4 initialized (multiblock).
[   10.407583] IFX DEU SHA1 initialized.
[   10.411197] IFX DEU MD5 initialized.
[   10.414750] IFX DEU SHA1_HMAC initialized.
[   10.418858] IFX DEU MD5_HMAC initialized.
[   10.441322] nf_conntrack version 0.5.0 (1950 buckets, 7800 max)
[   10.467693] NET: Registered protocol family 24
[   10.492010] xt_time: kernel timezone is -0000
[   10.570101] cfg80211: World regulatory domain updated:
[   10.573843] cfg80211:  DFS Master region: unset
[   10.578149] cfg80211:   (start_freq - end_freq @ bandwidth), (max_antenna_gain, max_eirp), (dfs_cac_time)
[   10.587910] cfg80211:   (2402000 KHz - 2472000 KHz @ 40000 KHz), (N/A, 2000 mBm), (N/A)
[   10.595915] cfg80211:   (2457000 KHz - 2482000 KHz @ 40000 KHz), (N/A, 2000 mBm), (N/A)
[   10.603930] cfg80211:   (2474000 KHz - 2494000 KHz @ 20000 KHz), (N/A, 2000 mBm), (N/A)
[   10.611936] cfg80211:   (5170000 KHz - 5250000 KHz @ 80000 KHz, 160000 KHz AUTO), (N/A, 2000 mBm), (N/A)
[   10.621421] cfg80211:   (5250000 KHz - 5330000 KHz @ 80000 KHz, 160000 KHz AUTO), (N/A, 2000 mBm), (0 s)
[   10.630919] cfg80211:   (5490000 KHz - 5730000 KHz @ 160000 KHz), (N/A, 2000 mBm), (0 s)
[   10.639003] cfg80211:   (5735000 KHz - 5835000 KHz @ 80000 KHz), (N/A, 2000 mBm), (N/A)
[   10.647007] cfg80211:   (57240000 KHz - 63720000 KHz @ 2160000 KHz), (N/A, 0 mBm), (N/A)
[   10.882638] PCI: Enabling device 0000:00:0e.0 (0000 -> 0002)
[   10.887054] rt2800pci 0000:00:0e.0: failed to load eeprom property
[   10.893073] ieee80211 phy0: rt2x00lib_request_eeprom_file: Info - Loading EEPROM data from 'RT3062.eeprom'.
[   10.904378] ieee80211 phy0: rt2x00_set_rt: Info - RT chipset 3572, rev 0223 detected
[   10.910747] ieee80211 phy0: rt2x00_set_rf: Info - RF chipset 0008 detected
[   10.918268] ieee80211 phy0: Selected rate control algorithm 'minstrel_ht'
[   18.754109] device eth0 entered promiscuous mode
[   18.771096] br-lan: port 1(eth0) entered forwarding state
[   18.775143] br-lan: port 1(eth0) entered forwarding state
[   19.273002] cfg80211: Regulatory domain changed to country: NL
[   19.277446] cfg80211:  DFS Master region: ETSI
[   19.281676] cfg80211:   (start_freq - end_freq @ bandwidth), (max_antenna_gain, max_eirp), (dfs_cac_time)
[   19.291427] cfg80211:   (2402000 KHz - 2482000 KHz @ 40000 KHz), (N/A, 2000 mBm), (N/A)
[   19.299439] cfg80211:   (5170000 KHz - 5250000 KHz @ 80000 KHz, 160000 KHz AUTO), (N/A, 2000 mBm), (N/A)
[   19.308928] cfg80211:   (5250000 KHz - 5330000 KHz @ 80000 KHz, 160000 KHz AUTO), (N/A, 2000 mBm), (0 s)
[   19.318419] cfg80211:   (5490000 KHz - 5710000 KHz @ 160000 KHz), (N/A, 2700 mBm), (0 s)
[   19.326509] cfg80211:   (57000000 KHz - 66000000 KHz @ 2160000 KHz), (N/A, 4000 mBm), (N/A)
[   20.552300] ieee80211 phy0: rt2x00lib_request_firmware: Info - Loading firmware file 'rt2860.bin'
[   20.561561] ieee80211 phy0: rt2x00lib_request_firmware: Info - Firmware detected - version: 0.34
[   20.672586] IPv6: ADDRCONF(NETDEV_UP): wlan0: link is not ready
[   20.778920] br-lan: port 1(eth0) entered forwarding state
[   22.624040] wlan0: authenticate with 02:13:49:11:66:8c
[   22.647175] wlan0: send auth to 02:13:49:11:66:8c (try 1/3)
[   22.807008] wlan0: authenticated
[   22.811138] wlan0: associate with 02:13:49:11:66:8c (try 1/3)
[   22.819233] wlan0: RX AssocResp from 02:13:49:11:66:8c (capab=0xc11 status=0 aid=1)
[   22.825694] wlan0: associated
[   22.828623] IPv6: ADDRCONF(NETDEV_CHANGE): wlan0: link becomes ready
[   27.401764] random: nonblocking pool is initialized
And pitty enough, with this new code (& probably newer Privoxy), my Pokergame wont start, missing internet? (or that's another issue, now...)
That's because DHCP isn't working (anymore) in 4.1.11?
OpenWrt CC r44257, does do the DHCP normally & works fine (also with the poker app).
This is probably due to .dts settings on the r44257 build, i have to check this.
But some other strange things are going around here ...
DG.